|
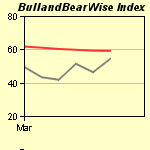
The BullandBearWise Index of economic and
market indicators:
Growth
Gross Domestic
Product
Non-Farm Productivity
Non-Manufacturing ISM
Labor
Initial
Jobless Claims
Unemployment Rate
Commodity
DJ UBS Commodity Index
London Gold
Sweet Crude
Consumer
Consumer Credit
Personal Income
Retail Sales
Manufacturing
Capacity
Utilization
Durable Goods
Factory Orders
Industrial Production
Manufacturing ISM
Inflation
Agricultural Prices
Consumer Price Index
Producer Price Index
Financial
S&P 500 Index
S&P 500 P/E Ratio
DJIA/S&P 500 Divergence
Advance Decline Ratio
Money - Zero Maturity
Officer Loan Survey
U.S. Treasury Yields
Volatility Index (VIX)
Investment
Housing Market Index (HMI)
Housing Starts
New Homes Sales
Trade
Dollar Cash Index
Trade Balance
Other areas of interest at
BullandBearWise:
Federal Reserve
Balance
Requirements
Federal Funds
Federal Funds Target Divergence
FOMC and the S&P 500
Foreign Custody Holdings
Money Supply
Money Supply Rate of Change
Non-Borrowed Reserves
Quantitative Easing
Securities Lending & POMO
Special Facilities
System Open market Account
Temporary Open Market Balance
Temporary Open Market Operations
Domestic
Operations 2011 Report 
U.S. Debt
Debt By Instrument
Debt Ownership
Debt and GDP
Foreign Treasury
Purchases
Statutory Debt Limit
Tax Collections
Treasury Borrowings
At Issue
Currency Growth
Dollar versus Oil and Gold
Dow 1929 Comparison
Federal Reserve Foreign Custody
Holdings
FOMC and the S&P 500
Gold Fear Index
Government Deficits
Home Equity
NASDAQ 100 Real Price-to-Earnings
Ratio (PE)
Household Debt Burden
Mortgage Debt
NASDAQ 2000 vs. Dow 1929
S&P 500 Reported vs
Operating Earnings
Velocity of Money
Yield Curve Since 1869
|
513/15
5/8/15
5/1/15
4/24/15
4/17/15
4/10/15
4/3/15
3/27/15
3/20/15
3/13/15
3/6/15
2/27/15
|
|
BullandBearWise
Index
|
|
53.73 |
|
The BullandBearWise Index weights
economic and market indicators from 0 (bearish) to 100 (bullish). |
|

|
|
Calendar
|
| No records returned. |
|
 |
|
|